Massachusetts has released its latest weekly data on the coronavirus pandemic, including an updated version of the state's new community-level risk assessment map.
The data, from the Department of Public Health, includes a breakdown of the total number of coronavirus cases in each Massachusetts city and town, as well as the new map.
Community Risk Assessment
Earlier this month, Gov. Charlie Baker revealed this new metric for understanding how much the virus has spread locally.
It shows the number of cases detected on average each day over the last two weeks in each of Massachusetts' communities. More than 8 cases per 100,000 translates to a high risk, between 4 and 8 cases per 100,000 is moderate risk, and any less than that is low risk, Baker said.
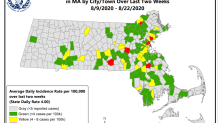
Cities and towns shaded red have the greatest risk levels. There are nine in this map, down from 10 in last week's map, which included data from Aug. 2-15.
The high-risk communities in Wednesday's report are Brockton, Chelsea, Everett, Framingham, Lawrence, Lynn, Revere, Sutton and Winthrop. Of those cities and towns, all but Sutton appear on the chart of communities ranked by percent positivity below. That town's rate of 2.4% is the 11th highest in the state, but its case count of 10 in the 14 days did not meet the threshold for the chart.
The data provided by the state in its weekly report on COVID-19 has changed as the pandemic has dragged on. Secretary of Health and Human Services Marylou Sudders said earlier this month that her agency recognizes that it's necessary to change what data the state reports as it moves into different phases of outbreak.
Recent Coronavirus Tests Returning Positive
Among cities and towns with at least 15 new cases in the last two weeks, these 25 communities have the highest percentages of positive cases in that time period:
| Community | Number of cases | Cases in the last 14 days | Average daily incidence rate per 100,000 in the last 14 days | Total tests in the last 14 days | Positive tests in the last 14 days | Percent positivity in the last 14 days |
| Lynn | 4,435 | 236 | 16.7 | 5,262 | 320 | 6.08% |
| Chelsea | 3,309 | 168 | 31.9 | 3,112 | 189 | 6.07% |
| Revere | 2,275 | 174 | 20.4 | 4,231 | 233 | 5.51% |
| Everett | 2,025 | 93 | 13.7 | 2,229 | 103 | 4.62% |
| Lawrence | 4,034 | 124 | 10 | 4,253 | 152 | 3.57% |
| Swansea | 167 | 17 | 7.6 | 545 | 18 | 3.3% |
| Brockton | 4,584 | 116 | 8.4 | 4,521 | 148 | 3.27% |
| Winthrop | 360 | 26 | 9.9 | 1,076 | 32 | 2.97% |
| Framingham | 1,960 | 91 | 8.7 | 3,594 | 100 | 2.78% |
| Saugus | 638 | 26 | 6.5 | 1,292 | 34 | 2.63% |
| Methuen | 1,143 | 46 | 6.1 | 2,178 | 51 | 2.34% |
| Milford | 708 | 25 | 6.1 | 1,353 | 29 | 2.14% |
| North Attleborough | 301 | 16 | 3.8 | 991 | 21 | 2.12% |
| Peabody | 1,134 | 39 | 5 | 2,533 | 53 | 2.09% |
| New Bedford | 2,357 | 60 | 4.3 | 3,395 | 69 | 2.03% |
| Marlborough | 1,099 | 31 | 5.1 | 1,810 | 36 | 1.99% |
| Salem | 759 | 41 | 6.5 | 2,896 | 57 | 1.97% |
| South Hadley | 209 | 18 | 7.1 | 1,243 | 23 | 1.85% |
| Boston | 16,002 | 691 | 7.1 | 45,494 | 826 | 1.82% |
| Springfield | 3,201 | 72 | 3.2 | 6,109 | 103 | 1.69% |
| Fall River | 1,887 | 45 | 3.6 | 3,721 | 62 | 1.67% |
| Malden | 1,384 | 34 | 3.6 | 2,835 | 47 | 1.66% |
| Canton | 334 | 16 | 5 | 1,362 | 22 | 1.62% |
| Dedham | 448 | 17 | 4.5 | 1,315 | 21 | 1.6% |
| Agawam | 526 | 16 | 4 | 1,611 | 24 | 1.49% |
Data from between Aug. 12, 2020, and Aug. 26, 2020, omitting communities with under 15 new cases in that span. The state notes that earlier reports were based on the number of people who tested positive, but this percentage is instead based on the total number of positive tests. Both tallies are listed in the chart above.
Lynn had the highest rate of positive tests among qualifying communities, as it did the last three weeks. Since last week, the city's rate improved from 7.09% to 6.08%. Chelsea, which had the second highest rate by just a hundredth of a percentage point, increased from 4.95% to 6.07%. Revere had the third highest rate with 5.51%, a slight increase from last week's rate of 5.4%.
The state's overall rate of positive tests has fluctuated, but it has been decreasing in each data set presented since early August. In the last 14 days, 1.3% of tests in Massachusetts came back positive. The rate of positive tests over two weeks was 1.5% on Aug. 19, 1.75% on Aug. 12, 1.82% on Aug. 5, 1.74% on July 29, 1.67% on July 22 and 1.91% on July 15.
Take a closer look at last week's list.
Get Boston local news, weather forecasts, lifestyle and entertainment stories to your inbox. Sign up for NBC Boston’s newsletters.