
There are now 30 communities considered at the highest risk for transmitting the new coronavirus in Massachusetts, according to the latest weekly community-level data on the pandemic, which no longer includes an updated town-by-town COVID-19 risk assessment map.
The total is nearly double the 16 towns and cities in the report last week, which had dramatically fewer communities in the highest-risk red zone after a major change in how Massachusetts determines risk of coronavirus transmission. (See this week's full red zone list below.)
The weekly data, from the Department of Public Health, includes a breakdown of the total number of coronavirus cases in each Massachusetts city and town, transmission rates, data on clusters and more.
Get Boston local news, weather forecasts, lifestyle and entertainment stories to your inbox. Sign up for NBC Boston’s newsletters.
It was released as the state's confirmed coronavirus death toll topped 10,000 and the number of confirmed cases remained at levels not seen since the tail end of the first surge in the spring.
See the Town-by-Town Mass. Coronavirus Risk Data
The following 30 communities are in the highest risk level as of Thursday: Brockton, Chelsea, Chicopee, Clinton, Dighton, Everett, Fall River, Fitchburg, Freetown, Holyoke, Lawrence, Leominster, Lowell, Lynn, Marion, Methuen, Milford, New Bedford, Norfolk, Plainville, Revere, Seekonk, Shirley, Somerset, Springfield, Swansea, Tisbury, Uxbridge, West Springfield and Westport.
Fourteen are newly in red on the list: Chicopee, Clinton, Dighton, Freetown, Holyoke, Leominster, Marion, Milford, Plainville, Shirley, Swansea, Tisbury, Uxbridge and West Springfield. No communities dropped out of red on the list.
The Department of Public Health is no longer including a map of the community-level risk in the weekly report. An official told NBC10 Boston that the map is no longer seen as being as helpful as it once was, now that coronavirus cases are being reported in most communities.
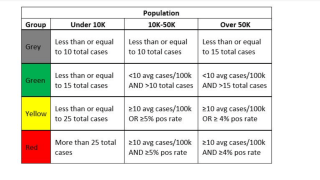
To qualify for the red category under the new metrics, communities with populations under 10,000 must have more than 25 cases. For mid-size communities of between 10,000 and 50,000 people, they must have an average of more than 10 cases per 100,000 people and a positive test rate of more than 5%. And for larger communities of greater than 50,000 people, they must have more than 10 cases per 100,000 people and a positive test rate of more than 4%.
Previously, the state used the number of cases detected on average each day over two weeks to determine if Massachusetts' communities are at high risk for coronavirus transmission. The new list factors in population size and positive test rate.
The report didn't say that any more communities were consistently in the red zone long enough to have to move back to Phase 3, Step 1 of Massachusetts' reopening plan.
According to the state's list, last updated Nov. 6, the cities and towns still in Phase 3, Step are: Abington, Acushnet, Attleboro, Avon, Berkley, Boston, Brockton, Canton, Chelmsford, Chelsea, Dracut, East Longmeadow, Everett, Fairhaven, Fall River, Framingham, Hanover, Hanson, Haverhill, Hingham, Holliston, Holyoke, Hudson, Kingston, Lawrence, Leicester, Lowell, Lynn, Lynnfield, Malden, Marlborough, Marshfield, Methuen, Middleton, Milford, Nantucket, New Bedford, North Andover, Pembroke, Plymouth, Randolph, Revere, Rockland, Saugus, Seekonk, Somerset, Springfield, Tyngsborough, Wakefield, Waltham, Webster, Westport, Weymouth, Winthrop, Woburn, Worcester and Wrentham.
State health officials have identified 6,913 coronavirus clusters through Nov. 7. That's 1,581 more clusters than were identified in the previous report, with data through Oct. 31. There are currently 2.16 COVID-19 cases associated with each cluster.
Read this week's full report here, with data on communities' percent positivity, county- and state-level data and more.
Changes to Massachusetts' Hot Spot Map
Massachusetts has changed its coronavirus metrics for the weekly report over time, including three significant revamps in the previous three weeks.
The most recent changes produced a major shift: knocking the number of communities in the red zone from 121 to 16 as what defined a high-risk community changed. Officials said the adjustment brought Massachusetts more in line with risk levels in other states.
Last week's report also dropped the map that displayed the town-by-town coronavirus data. It showed where in the state communities were at high, moderate or low risk of transmission, but officials said it was no longer very informative.
In the weeks before that, officials added information on COVID-19 clusters, both on where major clusters have been identified -- they're listed in the report with an asterisk -- and on trends among clusters.
The color-coded town-by-town data was introduced in August, and the Baker administration announced that the state would focus its strongest COVID-mitigation efforts on towns in the red category. Communities can only move to Step 2 of Phase 3 of Massachusetts' reopening plan, announced in late September, if they are not consistently in the red.
Before that data's introduction, the positive COVID test rate over the preceding 14 days was the standard for measuring hot spots. The Department of Public Health's weekly report still includes that information, along with other metrics like how many tests are being conducted locally and how many cases have been reported locally.
Some of Massachusetts' smaller towns took issue with having their risk assessed based on cases per capita alone. They had said that, when a town only had a few thousand people, an outbreak in just one household could send it into red under the criteria at the time: 8 cases of COVID-19 per 100,000 residents.
Officials said last week that the latest change to the data addressed those concerns.