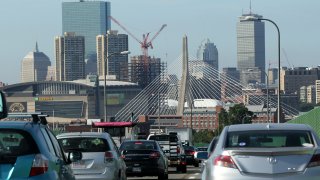
It should come as no surprise to any Boston driver that bumper-to-bumper traffic is back.
Not that Boston traffic was ever pleasant, but years of many companies allowing remote work during the pandemic did ease the load on many highways.
Workers have been steadily returning to the office, however, and traffic is on the rise — in some parts of the Greater Boston area by more than 10% in the last year, according to data from Waze shared with NBC10 Boston.
Traffic in Newton was 12.1% higher on Wednesday than it was a year before, according to Waze, while it rose 11.7% in Waltham and 10.9% in Framingham.
Get Boston local news, weather forecasts, lifestyle and entertainment stories to your inbox. Sign up for NBC Boston’s newsletters.
Boston's traffic was up as well, though only by 3.5%. Somerville was the only city in the Boston area to have traffic decrease, by 2.8%. (See the full list of traffic changes below)
For those looking to avoid slow roads, mass transit remains an option — and there's likely space on trains and buses.
MBTA ridership remains way down from before the pandemic — about 740,000 people riding each week as of this April, down 40% from April 2019, when more than 1.2 million people were riding the T each week.
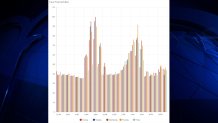
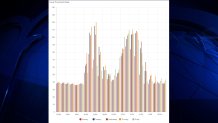
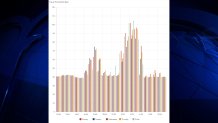
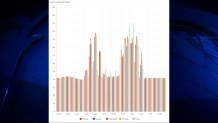
And for drivers who want to speed around faster while sticking to their cars, data from the Massachusetts Department of Transportation shows the typical travel time for vehicles along various stretches of major highways on average over the past 30 days.
Heading to work during rush hour can more than double the off-peak drive time, according to the data. Traffic on Fridays remains lower for most routes.
Explore the tool here to see how long your route to and from work takes on average by time of day. Below, find the charts for the entire corridors of I-90, I-93 and I-95 in the Boston area.
I-90 (Mass. Pike) between I-495 and Revere
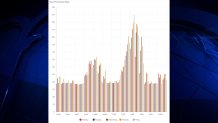
I-93 between I-495 in Andover and I-95 in Canton
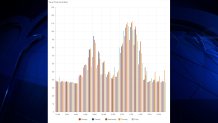
I-95 between Route 1 in Danvers and Route 1 in Sharon
Boston traffic changes
Boston metro area traffic on Wednesday, May 31, 2023, compared to Tuesday, May 31, 2022:
- Boston: Increased of 3.5%
- Cambridge: Increased of 5.1%
- Newton: Increased of 12.1%
- Waltham: Increased by 11.7%
- Framingham: Increased by 10.9%
- Quincy: Increased by 8%
- Somerville: Decreased by 2.8%
- Lowell: Increased by 5.8%
- Woburn: Increased by 5.7%
- Brookline: Increased by 4.3%
Cities in the Boston metro area, ranked from most to least traffic on Wednesday, May 31, 2023
- Boston
- Cambridge
- Newton
- Waltham
- Framingham
- Quincy
- Somerville
- Lowell
- Woburn
- Brookline
Source: Waze

