
Wastewater has been used as a metric to track COVID in the Boston area since the start of the pandemic, using bits of genetic material collected in sewage to indicate how much of the virus is circulating in the community.
The latest update from the Massachusetts Water Resources Authority's tracking system, on Thursday, shows a massive spike after the Christmas holiday -- from levels that were already at record highs.
STAY IN THE KNOW
Watch NBC10 Boston news for free, 24/7, wherever you are. |
|
Get Boston local news, weather forecasts, lifestyle and entertainment stories to your inbox. Sign up for NBC Boston’s newsletters. |
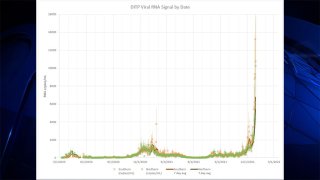
As of Thursday, when data was available through Dec. 28, COVID levels were averaging about 6,000 RNA copies of COVID per milliliter, with the most recent tests above 10,000.
329 medal events. 32 sports. Endless drama. Catch all the action at the Paris Olympics. Sign up for our free Olympics Headlines newsletter.
When the data was last available, six days earlier on Nov. 22, the average was at 2,500 RNA copies of COVID per milliliter, with the most recent samples under 6,000.
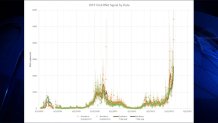
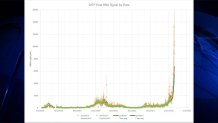
Here's that data in one animated chart to show the change:
The levels of COVID have begun to dwarf those of previous surges, while the scale of the chart's Y axis (at left) nearly triples in less than a week to be able to show it.
It's no surprise that COVID is spiking in the Boston area -- city and state data have been showing the same thing, and Wednesday's COVID case total for Massachusetts shattered the record set the previous week.
That data comes from molecular tests reported to the state, also known as PCR tests. At-home tests aren't taken into account in the state's data, and proponents of wastewater COVID detection have argued that it helps give a fuller sense of the virus' spread in a community, also including people who don't take tests at all.
The data for Boston is collected from the Massachusetts Water Resources Authority's Deer Island wastewater treatment plant and analyzed by Cambridge-based Biobot Analytics three to seven times a week.
Forty-three communities from eastern Massachusetts have their water treated at the plant, including Boston, Cambridge, Framingham and Quincy. The data cannot be linked to specific cities, towns or neighborhoods.
Other areas monitor wastewater for COVID as well -- Burlington, Vermont, detected the omicron variant in its wastewater this month before the first case was officially confirmed by the Vermont Department of Public Health.